stem
stem(xs, ys, [zs]; kwargs...)Plots markers at the given positions extending from offset along stem lines.
offset can be a number, in which case it sets y for 2D, and z for 3D stems. It can be a Point2 for 2D plots, as well as a Point3 for 3D plots. It can also be an iterable of any of these at the same length as xs, ys, zs.
The conversion trait of stem is PointBased.
Attributes
Available attributes and their defaults for MakieCore.Combined{Makie.stem, T} where T are:
  color            :black
  colormap         :viridis
  colorrange       MakieCore.Automatic()
  cycle            [[:stemcolor, :color, :trunkcolor] => :color]
  inspectable      true
  marker           :circle
  markersize       9
  offset           0
  stemcolor        :black
  stemcolormap     :viridis
  stemcolorrange   MakieCore.Automatic()
  stemlinestyle    "nothing"
  stemwidth        1.5
  strokecolor      :black
  strokewidth      0
  trunkcolor       :black
  trunkcolormap    :viridis
  trunkcolorrange  MakieCore.Automatic()
  trunklinestyle   "nothing"
  trunkwidth       1.5
  visible          true
Examples
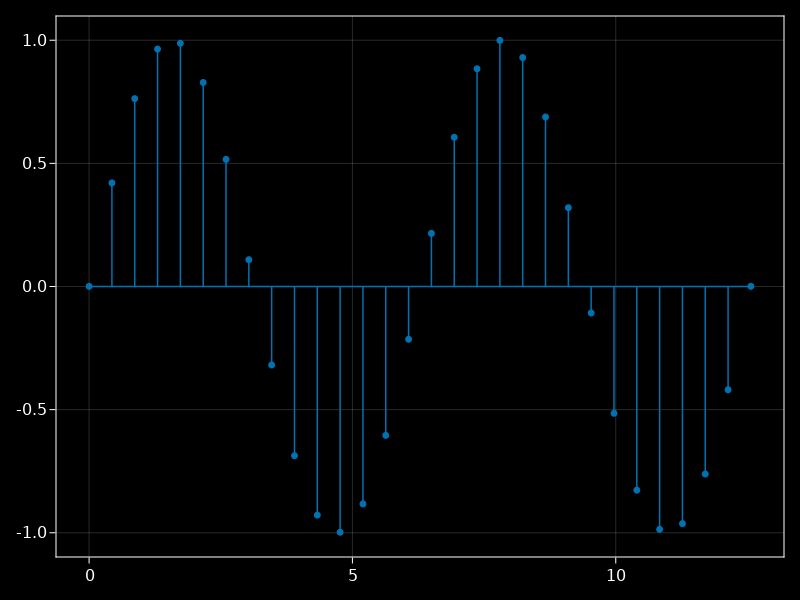
using CairoMakie

f = Figure()
Axis(f[1, 1])

xs = LinRange(0, 4pi, 30)

stem!(xs, sin.(xs))

f
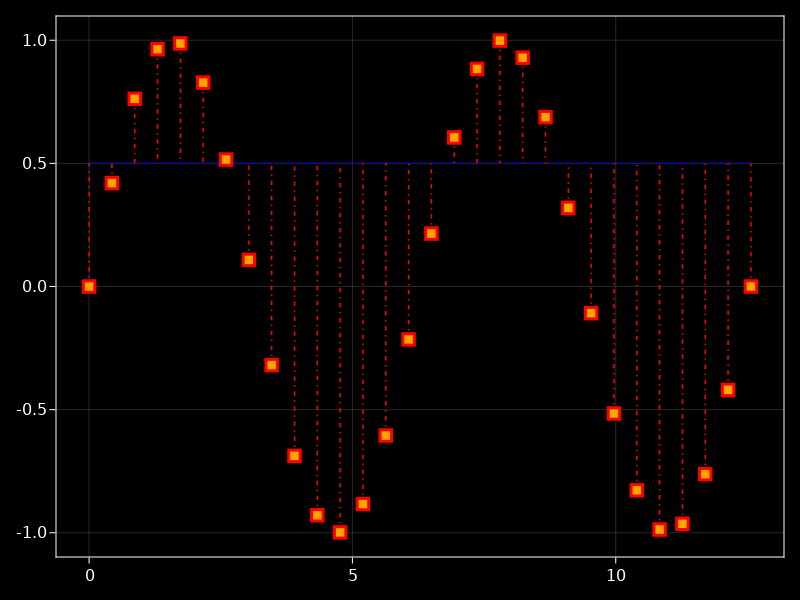
using CairoMakie

f = Figure()
Axis(f[1, 1])

xs = LinRange(0, 4pi, 30)

stem!(xs, sin,
    offset = 0.5, trunkcolor = :blue, marker = :rect,
    stemcolor = :red, color = :orange,
    markersize = 15, strokecolor = :red, strokewidth = 3,
    trunklinestyle = :dash, stemlinestyle = :dashdot)

f
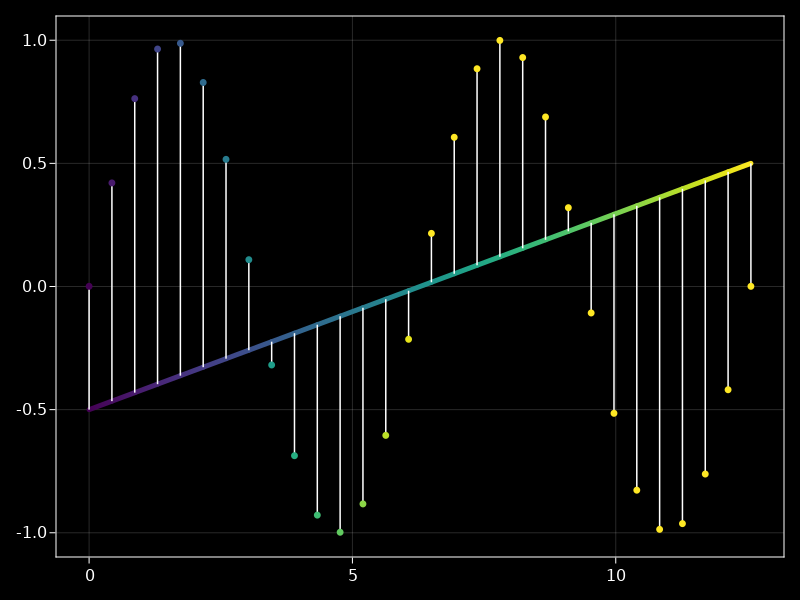
using CairoMakie

f = Figure()
Axis(f[1, 1])

xs = LinRange(0, 4pi, 30)

stem!(xs, sin.(xs),
    offset = LinRange(-0.5, 0.5, 30),
    color = LinRange(0, 1, 30), colorrange = (0, 0.5),
    trunkcolor = LinRange(0, 1, 30), trunkwidth = 5)

f
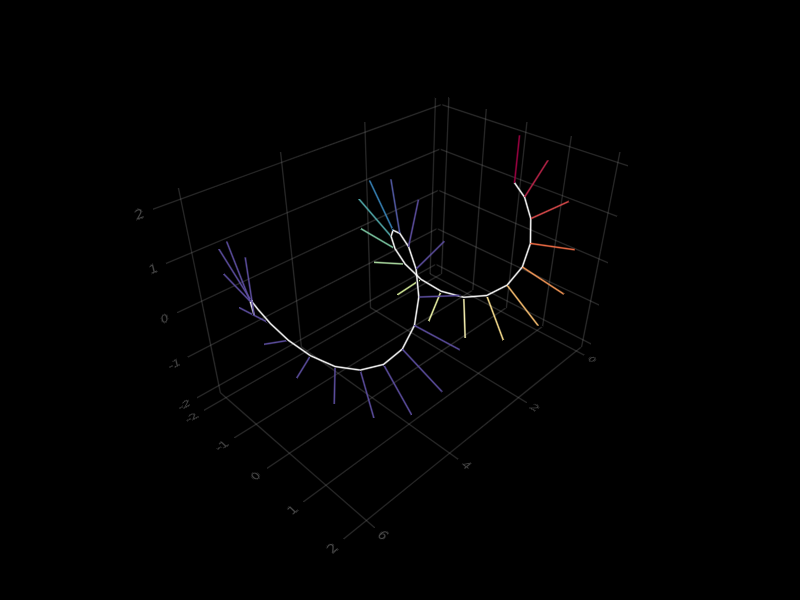
using GLMakie

f = Figure()

xs = LinRange(0, 4pi, 30)

stem(f[1, 1], 0.5xs, 2 .* sin.(xs), 2 .* cos.(xs),
    offset = Point3f.(0.5xs, sin.(xs), cos.(xs)),
    stemcolor = LinRange(0, 1, 30), stemcolormap = :Spectral, stemcolorrange = (0, 0.5))

f
© Makie.jl. Last modified: September 02, 2021. Website built with Franklin.jl and the Julia programming language.
These docs were autogenerated using Makie: v0.15.2, GLMakie: v0.4.6, CairoMakie: v0.6.5, WGLMakie: v0.4.6