errorbars
errorbars(x, y, error_both; kwargs...)
errorbars(x, y, error_low, error_high; kwargs...)
errorbars(x, y, error_low_high; kwargs...)

errorbars(xy, error_both; kwargs...)
errorbars(xy, error_low, error_high; kwargs...)
errorbars(xy, error_low_high; kwargs...)

errorbars(xy_error_both; kwargs...)
errorbars(xy_error_low_high; kwargs...)
Plots errorbars at xy positions, extending by errors in the given direction.
If you want to plot intervals from low to high values instead of relative errors, use rangebars.
Attributes
Available attributes and their defaults for MakieCore.Combined{Makie.errorbars, T} where T are:
  color         :black
  colormap      :viridis
  direction     :y
  inspectable   true
  linewidth     1.5
  visible       true
  whiskerwidth  0
Examples
using CairoMakie

f = Figure()
Axis(f[1, 1])

xs = 0:0.5:10
ys = 0.5 .* sin.(xs)

lowerrors = fill(0.1, length(xs))
higherrors = LinRange(0.1, 0.4, length(xs))

errorbars!(xs, ys, higherrors, color = :red) # same low and high error

# plot position scatters so low and high errors can be discriminated
scatter!(xs, ys, markersize = 3, color = :black)

f

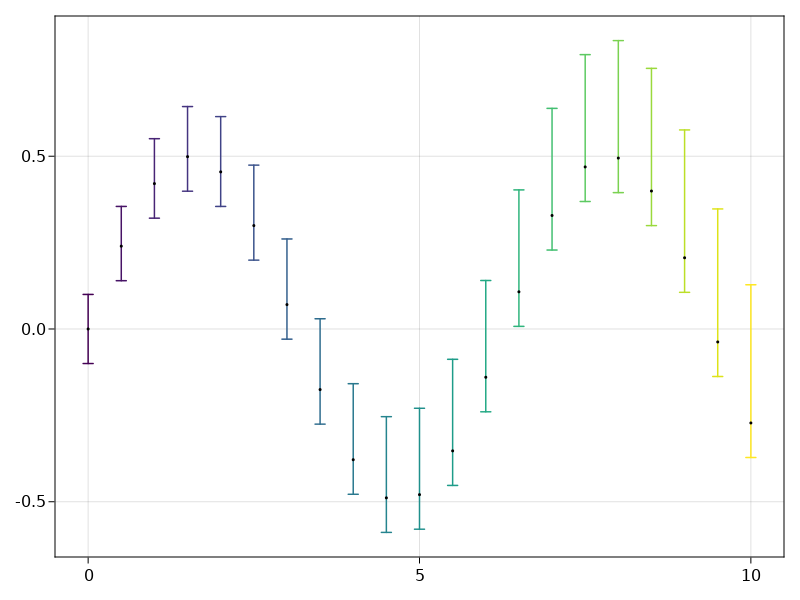
using CairoMakie

f = Figure()
Axis(f[1, 1])

xs = 0:0.5:10
ys = 0.5 .* sin.(xs)

lowerrors = fill(0.1, length(xs))
higherrors = LinRange(0.1, 0.4, length(xs))

errorbars!(xs, ys, lowerrors, higherrors,
    color = range(0, 1, length = length(xs)),
    whiskerwidth = 10)

# plot position scatters so low and high errors can be discriminated
scatter!(xs, ys, markersize = 3, color = :black)

f
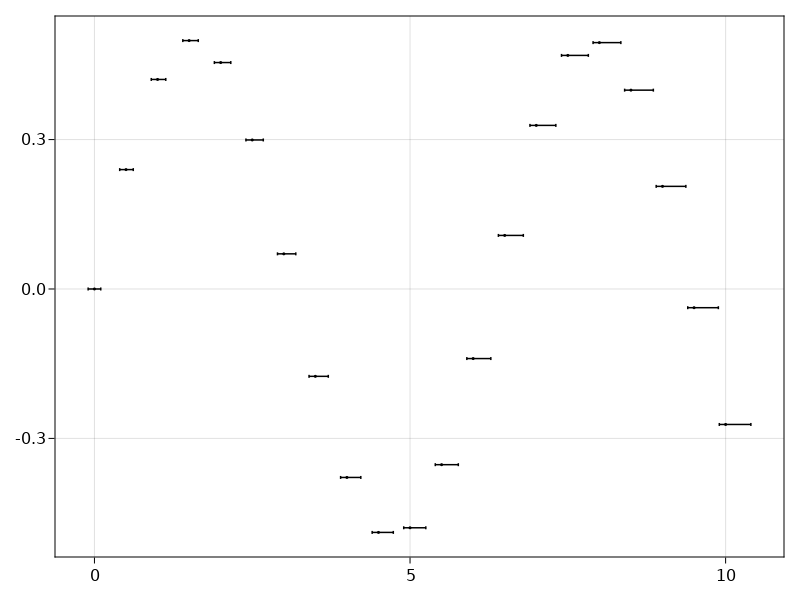
using CairoMakie

f = Figure()
Axis(f[1, 1])

xs = 0:0.5:10
ys = 0.5 .* sin.(xs)

lowerrors = fill(0.1, length(xs))
higherrors = LinRange(0.1, 0.4, length(xs))

errorbars!(xs, ys, lowerrors, higherrors, whiskerwidth = 3, direction = :x)

# plot position scatters so low and high errors can be discriminated
scatter!(xs, ys, markersize = 3, color = :black)

f
© Makie.jl. Last modified: September 02, 2021. Website built with Franklin.jl and the Julia programming language.
These docs were autogenerated using Makie: v0.15.2, GLMakie: v0.4.6, CairoMakie: v0.6.5, WGLMakie: v0.4.6