Slider
A simple slider without a label. You can create a label using a Label object, for example. You need to specify a range that constrains the slider's possible values.
The currently selected value is in the attribute value. Don't change this value manually, but use the function set_close_to!(slider, value). This is necessary to ensure the value is actually present in the range attribute.
You can double-click the slider to reset it (approximately) to the value present in startvalue.
If you set the attribute snap = false, the slider will move continously while dragging and only jump to the closest available value when releasing the mouse.
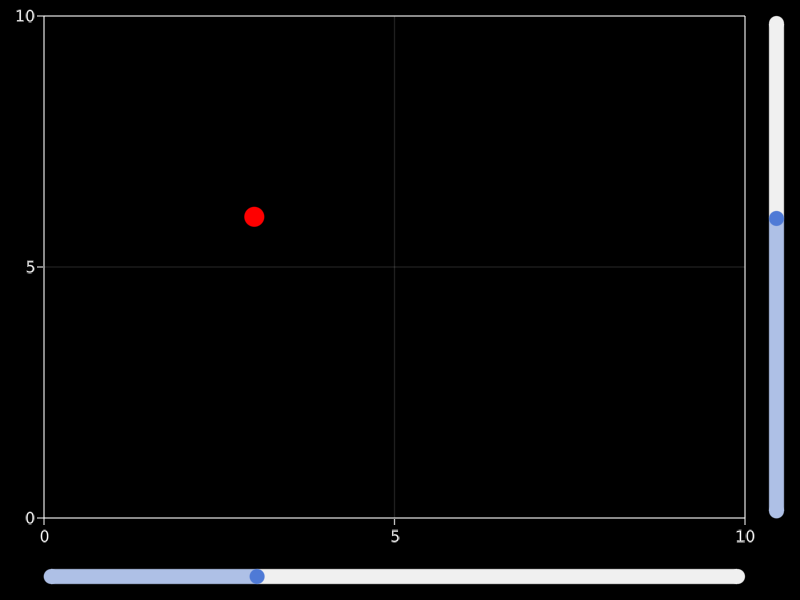
using GLMakie
fig = Figure()

ax = Axis(fig[1, 1])

sl_x = Slider(fig[2, 1], range = 0:0.01:10, startvalue = 3)
sl_y = Slider(fig[1, 2], range = 0:0.01:10, horizontal = false, startvalue = 6)

point = lift(sl_x.value, sl_y.value) do x, y
    Point2f(x, y)
end

scatter!(point, color = :red, markersize = 20)

limits!(ax, 0, 10, 0, 10)

fig
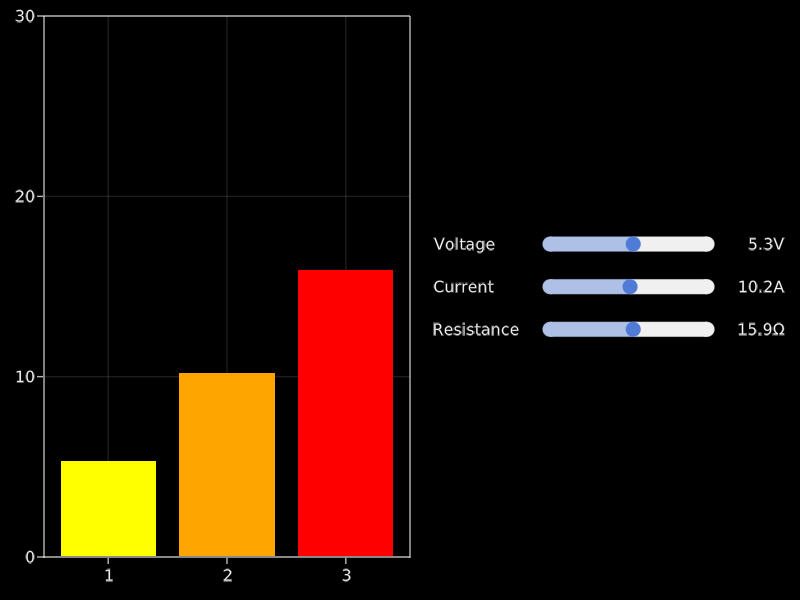
Labelled slider convenience functions
To create a horizontal layout containing a label, a slider, and a value label, use the convenience function Makie.MakieLayout.labelslider!, or, if you need multiple aligned rows of sliders, use Makie.MakieLayout.labelslidergrid!.
using GLMakie

fig = Figure()

ax = Axis(fig[1, 1])

lsgrid = labelslidergrid!(
    fig,
    ["Voltage", "Current", "Resistance"],
    [0:0.1:10, 0:0.1:20, 0:0.1:30];
    formats = [x -> "$(round(x, digits = 1))$s" for s in ["V", "A", "Ω"]],
    width = 350,
    tellheight = false)

fig[1, 2] = lsgrid.layout

sliderobservables = [s.value for s in lsgrid.sliders]
bars = lift(sliderobservables...) do slvalues...
    [slvalues...]
end

barplot!(ax, bars, color = [:yellow, :orange, :red])
ylims!(ax, 0, 30)

set_close_to!(lsgrid.sliders[1], 5.3)
set_close_to!(lsgrid.sliders[2], 10.2)
set_close_to!(lsgrid.sliders[3], 15.9)

fig
These docs were autogenerated using Makie: v0.15.2, GLMakie: v0.4.6, CairoMakie: v0.6.5, WGLMakie: v0.4.6