rangebars
rangebars(val, low, high; kwargs...)
rangebars(val, low_high; kwargs...)
rangebars(val_low_high; kwargs...)
Plots rangebars at val in one dimension, extending from low to high in the other dimension given the chosen direction.
If you want to plot errors relative to a reference value, use errorbars.
Attributes
Available attributes and their defaults for MakieCore.Combined{Makie.rangebars, T} where T are:
  color         :black
  colormap      :viridis
  direction     :y
  inspectable   true
  linewidth     1.5
  visible       true
  whiskerwidth  0
Examples
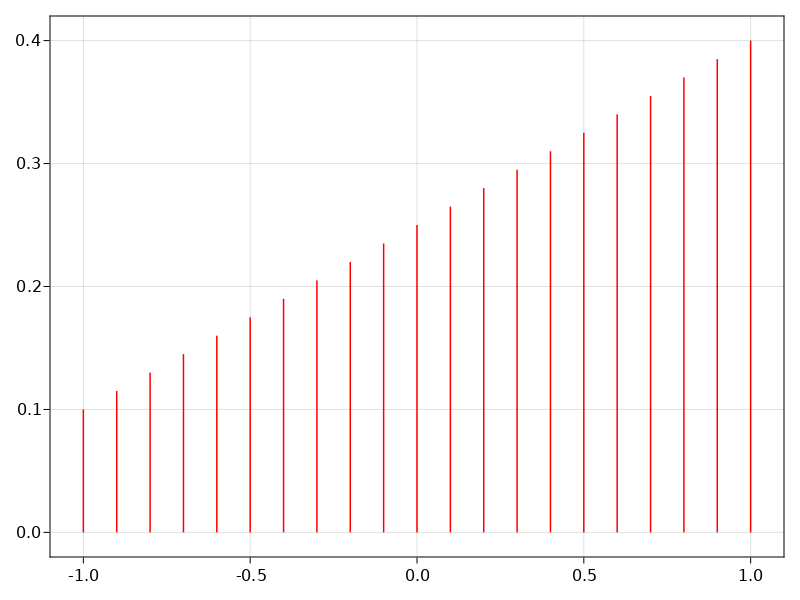
using CairoMakie

f = Figure()
Axis(f[1, 1])

vals = -1:0.1:1
lows = zeros(length(vals))
highs = LinRange(0.1, 0.4, length(vals))

rangebars!(vals, lows, highs, color = :red)

f
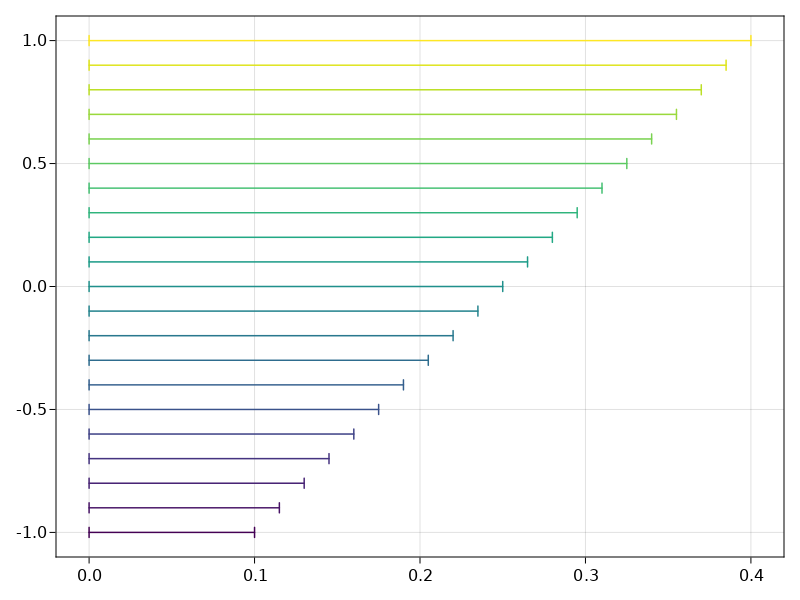
using CairoMakie

f = Figure()
Axis(f[1, 1])

vals = -1:0.1:1
lows = zeros(length(vals))
highs = LinRange(0.1, 0.4, length(vals))

rangebars!(vals, lows, highs, color = LinRange(0, 1, length(vals)),
    whiskerwidth = 10, direction = :x)

f
© Makie.jl. Last modified: September 02, 2021. Website built with Franklin.jl and the Julia programming language.
These docs were autogenerated using Makie: v0.15.2, GLMakie: v0.4.6, CairoMakie: v0.6.5, WGLMakie: v0.4.6