lines
lines(positions)
lines(x, y)
lines(x, y, z)
Creates a connected line plot for each element in (x, y, z), (x, y) or positions.
Tip
You can separate segments by inserting NaNs.
Examples
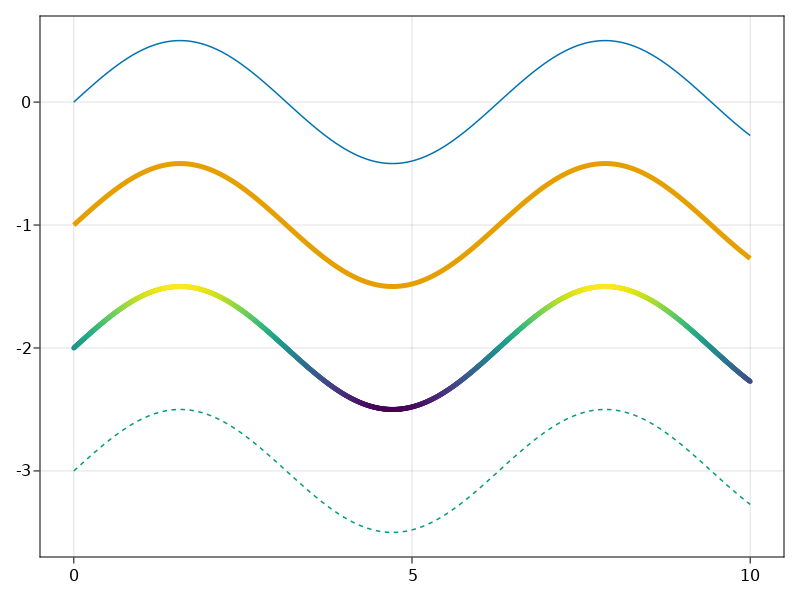
using CairoMakie

f = Figure()
Axis(f[1, 1])

xs = 0:0.01:10
ys = 0.5 .* sin.(xs)

lines!(xs, ys)
lines!(xs, ys .- 1, linewidth = 5)
lines!(xs, ys .- 2, linewidth = 5, color = ys)
lines!(xs, ys .- 3, linestyle = :dash)

f
© Makie.jl. Last modified: September 02, 2021. Website built with Franklin.jl and the Julia programming language.
These docs were autogenerated using Makie: v0.15.2, GLMakie: v0.4.6, CairoMakie: v0.6.5, WGLMakie: v0.4.6