boxplot
boxplot(x, y; kwargs...)Draw a Tukey style boxplot. The boxplot has 3 components:
a
crossbarspanning the interquartile (IQR) range with a midline marking the medianan
errorbarwhose whiskers spanrange * iqrpoints marking outliers, that is, data outside the whiskers
Arguments
x: positions of the categoriesy: variables within the boxes
Keywords
orientation=:vertical: orientation of box (:verticalor:horizontal)width=0.8: width of the boxshow_notch=false: draw the notchnotchwidth=0.5: multiplier ofwidthfor narrowest width of notchshow_median=true: show median as midlinerange: multiple of IQR controlling whisker lengthwhiskerwidth: multiplier ofwidthfor width of T's on whiskers, or:matchto matchwidthshow_outliers: show outliers as points
Examples
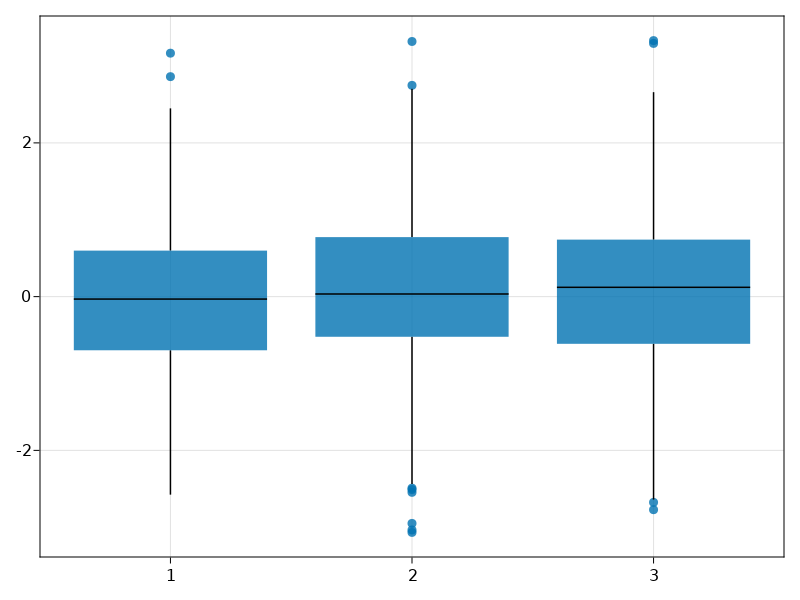
using CairoMakie

xs = rand(1:3, 1000)
ys = randn(1000)

boxplot(xs, ys)
using CairoMakie

xs = rand(1:3, 1000)
ys = randn(1000)
dodge = rand(1:2, 1000)

boxplot(xs, ys, dodge = dodge, show_notch = true, color = dodge)
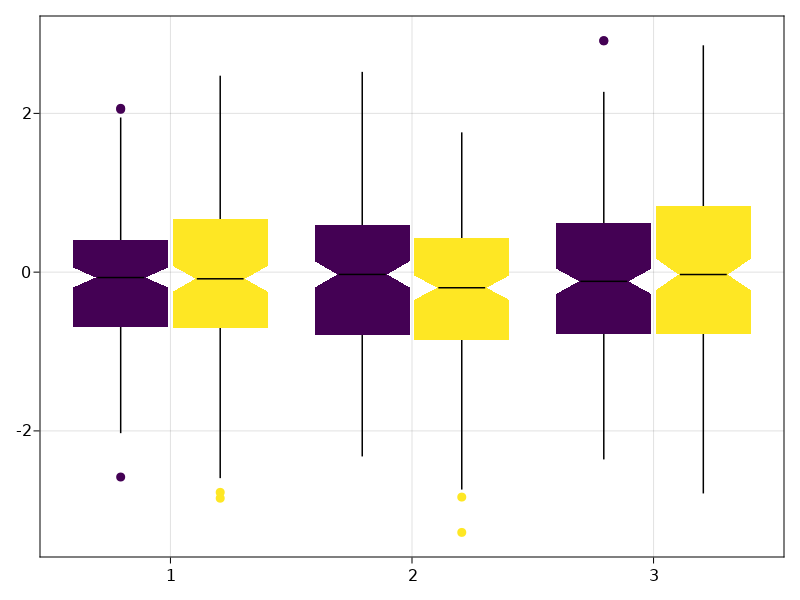
Colors are customizable. The color attribute refers to the color of the boxes, whereas outliercolor refers to the color of the outliers. If not scalars (e.g. :red), these attributes must have the length of the data. If outliercolor is not provided, outliers will have the same color as their box, as shown above.
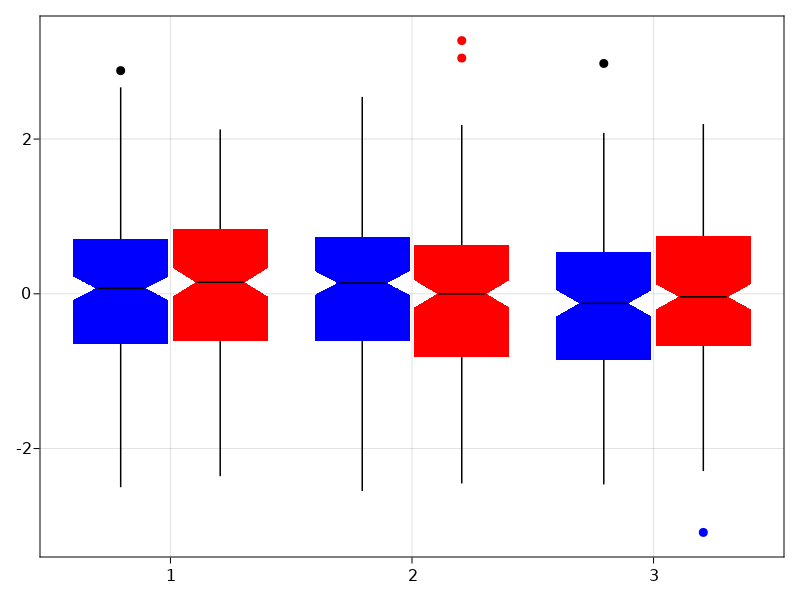
Note
For all indices corresponding to points within the same box, color (but not outliercolor) must have the same value.
using CairoMakie

xs = rand(1:3, 1000)
ys = randn(1000)
dodge = rand(1:2, 1000)

boxplot(xs, ys, dodge = dodge, show_notch = true, color = map(d->d==1 ? :blue : :red, dodge) , outliercolor = rand([:red, :green, :blue, :black, :yellow], 1000))
These docs were autogenerated using Makie: v0.15.2, GLMakie: v0.4.6, CairoMakie: v0.6.5, WGLMakie: v0.4.6