scatter
scatter(positions)
scatter(x, y)
scatter(x, y, z)
Plots a marker for each element in (x, y, z), (x, y), or positions.
Examples
using CairoMakie

f = Figure()
Axis(f[1, 1])

xs = LinRange(0, 10, 20)
ys = 0.5 .* sin.(xs)

scatter!(xs, ys, color = :red)
scatter!(xs, ys .- 1, color = xs)
scatter!(xs, ys .- 2, markersize = LinRange(5, 30, 20))
scatter!(xs, ys .- 3, marker = 'a':'t', strokewidth = 0, color = :black)

f

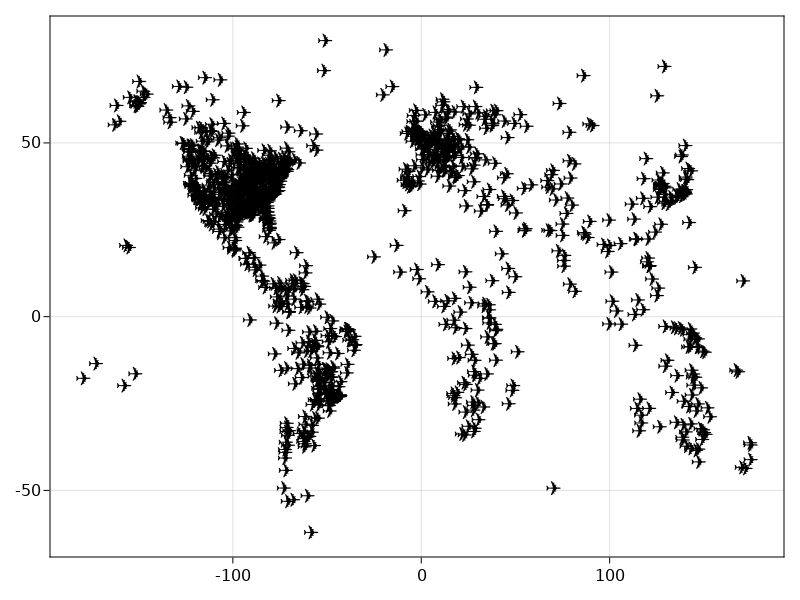
using CairoMakie
using DelimitedFiles

a = readdlm(assetpath("airportlocations.csv"))

scatter(a[1:50:end, :], marker = '✈',
    markersize = 20, color = :black)
© Makie.jl. Last modified: September 02, 2021. Website built with Franklin.jl and the Julia programming language.
These docs were autogenerated using Makie: v0.15.2, GLMakie: v0.4.6, CairoMakie: v0.6.5, WGLMakie: v0.4.6