Colorbar
A Colorbar needs a colormap and a tuple of low/high limits. The colormap's axis will then span from low to high along the visual representation of the colormap. You can set ticks in a similar way to Axis.
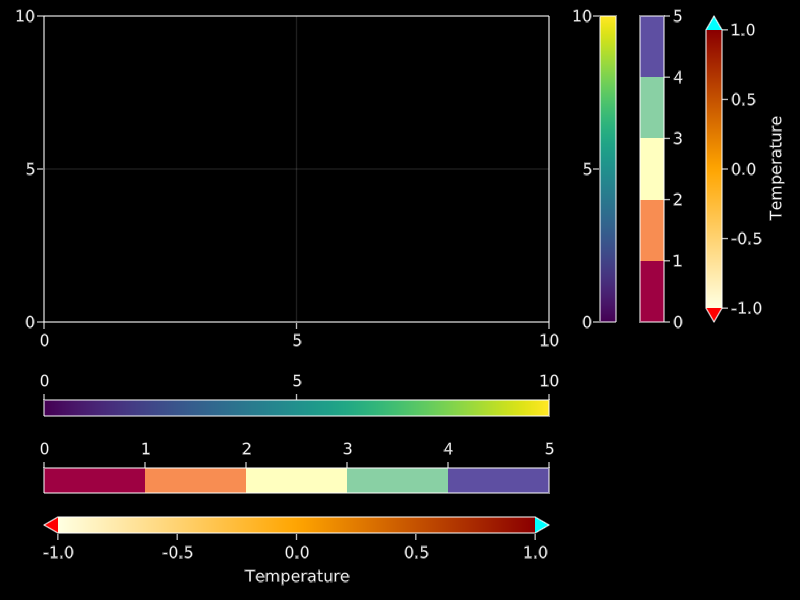
Here's how you can create Colorbars manually.
using CairoMakie

fig = Figure()

Axis(fig[1, 1])

# vertical colorbars
Colorbar(fig[1, 2], limits = (0, 10), colormap = :viridis,
    flipaxis = false)
Colorbar(fig[1, 3], limits = (0, 5),
    colormap = cgrad(:Spectral, 5, categorical = true), size = 25)
Colorbar(fig[1, 4], limits = (-1, 1), colormap = :heat,
    highclip = :cyan, lowclip = :red, label = "Temperature")

# horizontal colorbars
Colorbar(fig[2, 1], limits = (0, 10), colormap = :viridis,
    vertical = false)
Colorbar(fig[3, 1], limits = (0, 5), size = 25,
    colormap = cgrad(:Spectral, 5, categorical = true), vertical = false)
Colorbar(fig[4, 1], limits = (-1, 1), colormap = :heat,
    label = "Temperature", vertical = false, flipaxis = false,
    highclip = :cyan, lowclip = :red)

fig
If you pass a plotobject, a heatmap or contourf, the Colorbar is set up automatically such that it tracks these objects' relevant attributes like colormap, colorrange, highclip and lowclip. If you want to adjust these attributes afterwards, change them in the plot object, otherwise the Colorbar and the plot object will go out of sync.
using CairoMakie

xs = LinRange(0, 20, 50)
ys = LinRange(0, 15, 50)
zs = [cos(x) * sin(y) for x in xs, y in ys]

fig = Figure()

ax, hm = heatmap(fig[1, 1][1, 1], xs, ys, zs)
Colorbar(fig[1, 1][1, 2], hm)

ax, hm = heatmap(fig[1, 2][1, 1], xs, ys, zs, colormap = :grays,
    colorrange = (-0.75, 0.75), highclip = :red, lowclip = :blue)
Colorbar(fig[1, 2][1, 2], hm)

ax, hm = contourf(fig[2, 1][1, 1], xs, ys, zs,
    levels = -1:0.25:1, colormap = :heat)
Colorbar(fig[2, 1][1, 2], hm, ticks = -1:0.25:1)

ax, hm = contourf(fig[2, 2][1, 1], xs, ys, zs,
    colormap = :Spectral, levels = [-1, -0.5, -0.25, 0, 0.25, 0.5, 1])
Colorbar(fig[2, 2][1, 2], hm, ticks = -1:0.25:1)

fig

© Makie.jl. Last modified: September 02, 2021. Website built with Franklin.jl and the Julia programming language.
These docs were autogenerated using Makie: v0.15.2, GLMakie: v0.4.6, CairoMakie: v0.6.5, WGLMakie: v0.4.6